Calculates statistics based on a designated attribute or set of attributes of the incoming features.
If a feature does not contain attributes with the specified names, or these attributes do not contain a valid number, then it will be treated as having an empty string value for each specified attribute. Numbers that begin with '0' will be treated as octal values. Numbers that begin with '0x' will be treated as hexadecimal values.
Input Ports
All features enter the transformer through the Input port.
Output Ports
A single new feature will be output containing the statistics attributes for each group. If features are not grouped, the latter will emit a single feature containing the statistics for the whole set of input features.
No summary data will be generated if no input is received.
All Input features will all be passed through this output with all the statistics attributes for their group added onto them. Note that this will require all Input features to be stored until the end of translation, which can greatly increase the amount of memory and/or temporary disk storage usage.
All Input features will all be passed through this output with all the statistics attributes to date for their group added onto them. The features pass through this port immediately, each having the statistics computed for the set of features from the first feature in the group through to the current feature. (Note that this differs from the “final” statistics output in the Complete group.)
Parameters
Transformer
If Group By attributes are chosen, statistics will be calculated independently within each group of features. This can be used to create a pivot-table-like analysis of values in a data stream.
Note: How parallel processing works with FME: see About Parallel Processing for detailed information.
This parameter determines whether or not the transformer should perform the work across parallel processes. If it is enabled, a process will be launched for each group specified by the Group By parameter.
Parallel Processing Levels
For example, on a quad-core machine, minimal parallelism will result in two simultaneous FME processes. Extreme parallelism on an 8-core machine would result in 16 simultaneous processes.
You can experiment with this feature and view the information in the Windows Task Manager and the Workbench Log window.
No: This is the default behavior. Processing will only occur in this transformer once all input is present.
By Group: This transformer will process input groups in order. Changes of the value of the Group By parameter on the input stream will trigger batch processing on the currently accumulating group. This will improve overall speed if groups are large/complex, but could cause undesired behavior if input groups are not truly ordered.
Using Ordered input can provide performance gains in some scenarios, however, it is not always preferable, or even possible. Consider the following when using it, with both one- and two-input transformers.
Single Datasets/Feature Types: Are generally the optimal candidates for Ordered processing. If you know that the dataset is correctly ordered by the Group By attribute, using Input is Ordered By can improve performance, depending on the size and complexity of the data.
If the input is coming from a database, using ORDER BY in a SQL statement to have the database pre-order the data can be an extremely effective way to improve performance. Consider using a Database Readers with a SQL statement, or the SQLCreator transformer.
Multiple Datasets/Feature Types: Since all features matching a Group By value need to arrive before any features (of any feature type or dataset) belonging to the next group, using Ordering with multiple feature types is more complicated than processing a single feature type.
Multiple feature types and features from multiple datasets will not generally naturally occur in the correct order.
One approach is to send all features through a Sorter, sorting on the expected Group By attribute. The Sorter is a feature-holding transformer, collecting all input features, performing the sort, and then releasing them all. They can then be sent through an appropriate filter (TestFilter, AttributeFilter, GeometryFilter, or others), which are not feature-holding, and will release the features one at a time to the transformer using Input is Ordered By, now in the expected order.
The processing overhead of sorting and filtering may negate the performance gains you will get from using Input is Ordered By. In this case, using Group By without using Input is Ordered By may be the equivalent and simpler approach.
In all cases when using Input is Ordered By, if you are not sure that the incoming features are properly ordered, they should be sorted (if a single feature type), or sorted and then filtered (for more than one feature or geometry type).
As with many scenarios, testing different approaches in your workspace with your data is the only definitive way to identify performance gains.
Attributes to Analyze
The list of attributes is created when you connect the transformer to an incoming feature. Choose all attributes whose statistics you wish to compute.
The traditional behavior of the StatisticsCalculator, when computing statistics for a single attribute, is to name the attributes containing the computed statistics exactly as they are specified, such as “_min”, “_max”, “_mean”, and so on. When computing statistics on more than a single attribute, the StatisticsCalculator must prepend the name of the attribute being analyzed onto the specified statistic names, so that they can be distinguished on the resulting feature.
This choice allows one to choose whether the attribute naming is determined automatically, in which case the traditional naming will take place when only a single attribute is selected for analysis, or if the attribute name is always appended regardless. That is, when this choice is set to For all results, the computed attributes will always be named with the analyzed attribute’s name prepended (such as “population._mean”), even if only one attribute is being analyzed. To return to the traditional behaviour, this choice must be set to For multiple results only.
Calculate Attributes
Each of the following statistics will be output in the respective attribute, if one is given. Leaving a computed attribute name blank will turn off computation of that attribute.
If more than a single attribute was chosen for Attributes to Analyze or Prepend Output Attribute Names is set to For all results, then the names of the computed attributes will be prefixed with the original attribute name. For example, if statistics are being calculated on the attributes “population” and “area”, and “_mean” is entered as the attribute into which to store the calculated mean value, resulting features will contain new attributes named “population._mean” and “area._mean” to contain the respective computed mean values.
- Minimum: The numerical minimum, unless at least one value is non-numeric, in which case this will be the lexical minimum.
- Maximum: The numerical maximum, unless at least one value is non-numeric, in which case this will be the lexical maximum.
- Median: The middle value when the values are listed in order if the number of values is odd, or the average of the two middle values if the number of values is even. If there is at least one non-numeric input value, then the list is sorted lexically, and the first of the two middle values is taken as the median if the number of values is even.
- Total Count: The input feature count.
- Numeric Count: The number of numeric values that entered the transformer. In particular, empty, missing, and null values are ignored, and are not included in this count.
- Sum: The sum of all numeric values, or a blank string if there were no numeric values.
- Range: Equal to the maximum minus the minimum, or a blank string if any value is not numeric.
- Mean: The sum of all numeric values divided by the number of numeric values, or a blank string if there were no numeric values.
- Standard Deviation (Sample): The standard deviation of all the numeric values, which are assumed to represent a sample of a population (calculated using the "nonbiased" or "n-1" method), or a blank string if there were zero or one numeric values. If the data values are large, the standard deviation calculation may fail. In this case, a warning will be logged and the returned standard deviation will be -1.
- Standard Deviation (Population): The standard deviation of all the numeric values, which comprise the entire population, or a blank string if there were zero or one numeric values. If the data values are large, the standard deviation calculation may fail. In this case, a warning will be logged and the returned standard deviation will be -1.
- Mode: The most frequent of all the values. If the dataset is bimodal (two or more values occur with the highest frequency) one of the values will be returned randomly.
- Histogram: If the Compute Histograms option is checked, the StatisticsCalculator will provide a count for each unique value encountered for the analyzed attribute. The results are given as a structured list of attributes which present (value,count) pairs. There are two possibilities for the structure of this list:
- If the Histogram List Attribute parameter is given a value, the resulting list attributes will be named <resultAttribute>{<index>}.value and <resultAttribute>{<index>}.count. For example: “_histogram{0}.value”, “_histogram{0}.count”, “_histogram{1}.value”, “_histogram{1}.count”, etc.
- If the Histogram List Attribute parameter is left blank, the resulting list attributes will be named after the attribute on which the histogram was computed. For example, “region{0}.value”, “region{0}.count”, “region{1}.value”, “region{1}.count”, etc.
Example
The StatisticsCalculator transformer can generate statistics for groups of features rather than all features. This effectively adds the ability to create pivot tables in FME similar to the pivot tables in Excel.
Note: The AttributePivoter transformer provides a simpler approach to generate some forms of pivot tables.
Source Table and Excel Pivot Table
Fictitious data generated in Excel was exported it to a CSV file for use in Workbench. A simple pivot table was also created in Excel to show what we want to produce from FME; basically we want to summarize observed values based on region and potential.

FME Pivot Table
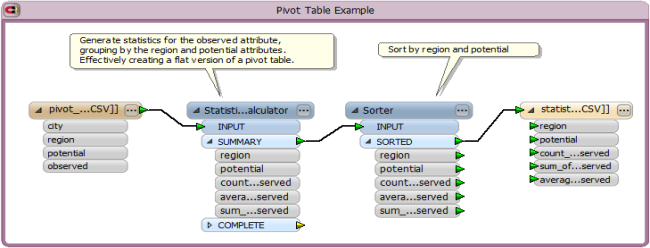
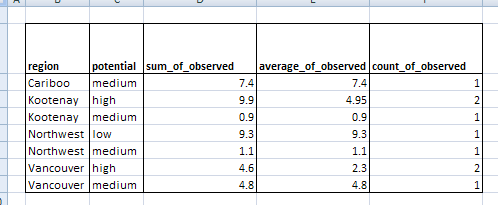
The workspace shown below uses the StatisticsCalculator transformer to create statistics for the observed attribute by first grouping features by region and potential. Then the new statistics features are sorted by region and potential, and output to a CSV file. The resulting CSV file has all of the same attributes/fields as the Excel pivot table.

The table written by FME and viewed in Excel resembles the Excel pivot table:

You can also use the ChartGenerator transformer to chart the data.
Editing Transformer Parameters
Using a set of menu options, transformer parameters can be assigned by referencing other elements in the workspace. More advanced functions, such as an advanced editor and an arithmetic editor, are also available in some transformers. To access a menu of these options, click  beside the applicable parameter. For more information, see Transformer Parameter Menu Options.
Transformer Categories
Search FME Knowledge Center
Search for samples and information about this transformer on the FME Knowledge Center.