Workbench provides tools that allow you to inspect data at the feature level with the Feature Inspector, and at the dataset level with the FME Universal Viewer/Data Inspector. Using the Feature Inspector can significantly reduce the amount of time it takes to author and test a workspace.
Instead of looking at the log window for information during or after a translation, or routing output to Inspector transformers so you can view the features, you can analyze features in real time as they move through the workspace.
Before you can run a translation with feature inspection, you will have to set at least one inspection point in the workspace.
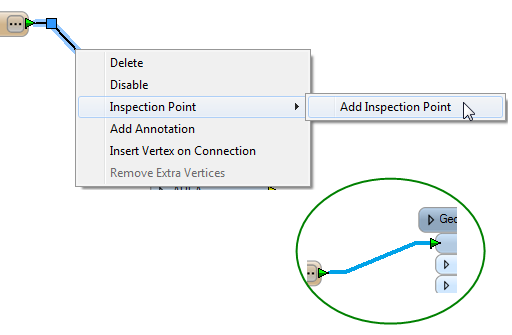
Select a link until it is highlighted and showing squares on both ends of the link. Right-click to display the command menu and click Inspection Point > Add Inspection Point. You can also set an inspection point by selecting the link and pressing F9. When the inspection point is defined, it will appear in the workspace as a bold, blue line.
There are several ways to use the Feature Inspector in a workspace:
To run a workspace using the feature inspection capability, click the Run Translation with Inspection tool:

Note that there are three Run buttons. Make sure you click the one that starts the Feature Inspector.
You can also click Inspection > Run Translation with Inspection or use the Shift + F5 keyboard shortcut.
How to Use the Feature Inspector
About the Feature Inspector Window
Editing Inspection Point Parameters