About Feature Inspection
To take advantage of feature inspection, use the following options from the Workbench Run menu or Toolbar:
-
 Run with Feature Caching (Ctrl+F5): Run all or part of a workspace and inspect features at select output ports.
 - Feature caching affects system resources, and because all features are recorded and stored, it can also affect disk space. You may not want to run all workspaces in this mode.
- Data caches do not maintain input feature order, such as when workspaces run from multiple caches, or transformers run in Group Processing mode that specifies Complete Groups: When Group Changes (Advanced). To avoid unexpected results, place a junction before the location in the workspace where you expect a specific order, and use the junction as the basis for starting or stopping a partial translation (see Running and Inspecting Part of a Workspace, below).
- You make a change to a workspace, and you want to see quickly how the change affects your data.
- You are preparing data for input, and you want to see quickly how it looks.
-
 Run From This (or Selected) (F6): All parts of the workspace that flow from a selected object (or objects) run.
 -
 Run Just This (or Selected): Only a selected object (or objects) runs. If a collapsed bookmark is included in the selection, only the objects within the bookmark run.
 -
 Run To This (or Selected): All parts of the workspace that flow to a selected object (or objects) run.
 -
 Run Between Selected: All parts of the workspace that flow between the selected objects run.
 - The caches were not saved with the workspace, and the workspace has not yet been run in Feature Caching mode.
- You make a change to the workspace that invalidates one or more caches.
This option seamlessly integrates the workspace with the Data Inspector. When enabled, output ports record features in temporary caches, which you can view and inspect after a translation is finished. With feature caching, you can choose to run the entire workspace, or a portion of it.
This example workspace shows the canvas after running with feature caching (mouse-over to view):
To view recorded features, click an inspection icon on an output port ( ).
).
The features output at that port are presented in the Visual Preview pane or the FME Data Inspector, depending on your Data Inspection settings in Tools > FME Options > Workbench.
To show features from multiple output ports, select one or more objects, right-click, and select Inspect cached features.
Limitations of Feature Caching
When you run a workspace with feature caching, keep in mind the following:
Running and Inspecting Part of a Workspace
You can select one or more objects on the canvas, and run only part of a workspace for inspection. Large workspaces, especially those that access large data sets, can take time to run in full. Running a partial workspace can save time and resources when:
You can run partial workspaces in the following ways:
Working with Data Caches - Other Considerations
When Run with Feature Caching is enabled, FME caches data at the output ports of a workspace. If any data caches are missing or stale where current ones are required, you are prompted to run all parts of the workspace that require updated data caches. This can happen when:
When a cache is invalid, its corresponding inspection icon turns yellow ( ). (You can still click on an invalid icon to inspect features, though they may no longer be valid.)
When a workspace with existing data caches is run, FME includes any up-to-date caches in the run as required, but their corresponding objects do not run as part of the overall translation. To run the entire workspace and regenerate all caches, including up-to-date ones, specify Run > Run Entire Workspace (Shift + F5).
Tip: Use Junctions to create caches where data either merges, or diverges in separate streams, as a useful starting point for partial runs.
Partial caching
To conserve resources, you can prevent FME from caching portions of a workspace, if you know those portions do not require caching for producing accurate runs. Place the parts of the workspace you do not want to be cached in a bookmark, then collapse the bookmark.
-
 Run with Breakpoints (Ctrl+Shift+F5): Run a workspace and inspect data one feature at a time, pausing between features (Feature Inspector).
Before you can view features in this mode, set at least one breakpoint in the workspace. The workspace will run until it reaches this breakpoint, and the Feature Inspector window will open.
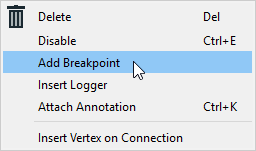
To set a breakpoint, select a link until it is highlighted. Right-click to display the command menu and click Add Breakpoint (or press the F9 key).

A breakpoint appears in the workspace as a bold, blue line with a red "stop sign" octagon.
Note: In the example below, the number inside the octagon indicates the feature count display from the previous workspace run. If you have not yet run your workspace, the octagon displays a solid color.

