About Feature Inspection
- You can run a workspace in "inspection mode" so you can see feature counts as features move across the canvas, through connections, and to output ports.
- You can inspect the properties (attributes and geometry) of an individual feature without having to send the workspace to an Inspector application.
- If you want to add a transformer, especially to a large workspace or a workspace that reads a great deal of input data, you can see the effect it will have on a feature without having to wait for the entire workspace to complete.
Run with Full Inspection and Run with Breakpoints
Workbench provides tools that allow you to inspect data at the feature level with the Feature Inspector, and at the dataset level with the FME Data Inspector. In the Workbench Run menu, two additional options allow you to run the workspace in a more controlled fashion:
-
 Run with Full Inspection: Run the workspace and inspect all features (together or individually) at the dataset level (Data Inspector).
 -
 Run with Breakpoints: Run the workspace and inspect data one feature at a time, pausing between features (Feature Inspector).
This option seamlessly integrates the workspace with the Data Inspector. FME records features and stores them in a temporary FME Feature Store (FFS) file. You can then inspect features individually, or all at once.
Note: This mode is particularly useful when you want to see where (and how many) features are flowing in the workspace, and for workspace debugging. However, this mode affects system resources, and, because all features are recorded and stored, it can also affect disk space. For these reasons, you might not want to run all workspaces in this mode.
All links and ports record features which you can view and inspect after the translation is finished. This example workspace shows the canvas after running a full inspection:

To view specific recorded features, double-click on a number either on a connection or port. (You can also right-click and select Inspect features from the context menu.)

This starts the Data Inspector, which shows the features that were recorded at that connection or port.
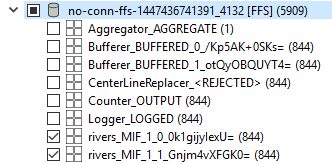
You can also right-click on any number and Inspect all recorded features. The Data Inspector opens the associated FFS file that contains all the features, from all links and ports. In the Data Inspector, you can choose to view all features or only selected features:

Before you can view features in this mode, set at least one breakpoint in the workspace. The workspace will run until it reaches this breakpoint, and the Feature Inspector window will open.
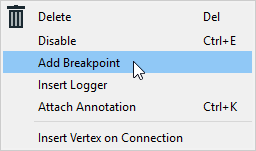
To set a breakpoint, select a link until it is highlighted. Right-click to display the command menu and click Add Breakpoint (or press the F9 key).

A breakpoint appears in the workspace as a bold, blue line with a red "stop sign" octagon.
Note: In the example below, the number inside the octagon indicates the feature count display from the previous workspace run. If you have not yet run your workspace, the octagon displays a solid color.
