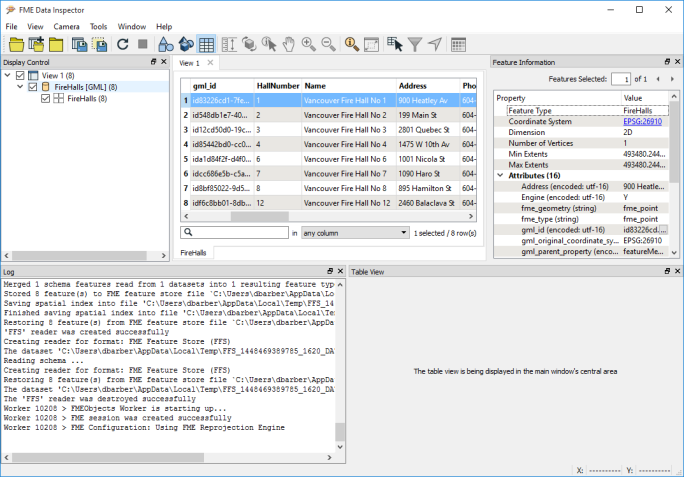
In addition to 2D or 3D view modes, you can view exposed user attribute data for features in table format. When either 2D or 3D view mode is active, the Table View window appears outside of the View Window, in another part of the interface (as long as it is selected in the View menu, under Windows). You can replace the 2D or 3D data in the View Window with the Table View by clicking the Table View icon ( ) on the toolbar, or pressing Ctrl+1 on your keyboard. The Table View appears directly in the View Window:
Alternatively, when not in Table View mode, you can drag and dock the Table View window to another part of the interface, or as a separate window.
Table View displays only exposed user attribute data.
The Table View displays data by feature type for each dataset. You can switch between dataset feature types by clicking on the tabs at the bottom of the Table View, or by double-clicking the feature type name in the Display Control window. You can also click and drag the tabs in a different order.
The data columns themselves can be moved by clicking and dragging on the column headers.
Table View displays only the first 2000 columns (attributes) of data.
Sorting Table Data
You can sort table data by clicking on the header of the desired sort column. The last column header that is clicked becomes the primary sort column, the second-to-last becomes the secondary sort column, and the third-to-last becomes the tertiary sort column. You can sort on a maximum of three columns. Click a column header again to change the sort order from ascending to descending. Right click on a column header to specify a sort order or to specify that a column be sorted on either its alphabetical or numeric properties. To clear all sorting, right click on any column header and select Clear All Sorting.
Selecting and Copying Rows
You can select and copy table rows using standard mouse and keyboard functions. To include table headers when copying, right click on the selected rows and choose Copy With Headers, or use Ctrl+Alt+C. Table View supports pasting into Excel.
Filtering Table Data
Using the filter tool at the bottom of the Table View, you can display only the rows that meet your filter criteria.
Viewing Large Values
Some attribute values may be truncated because they are too large to display in the Table View window. Click on the ellipsis beside the value, or double-click on the value, to display it in full in a separate window. There are several display and search options at the bottom of the Value window. Mouse over each option to display its description.
Viewing Null, Missing, Empty, and Blank Values
Null values and missing values are displayed as <null> and <missing>, respectively, with a gray font color. In comparison, Strings whose content is "<null>" or "<missing>" are displayed with the system default font color. Note that the display for missing values in Table View differs from that in Feature Information, where they are simply not displayed.
Empty values and blank (white space filled) values both appear blank in Table View. They can be distinguished in one of two ways. One, double click a field value in Table View to see the actual value in the Value Viewer. Two, select the Value column for the attribute of interest in Feature Information, where blank values and empty values would be displayed differently.